Editorial 1: Both government and non-government data show a healthy employment gain since pre-Covid 2019
Context:
- It is said that data is the new oil. Given this reality, data is the new politics, especially when official data are not present.
- As acknowledged by virtually all international organisations, Indian GDP growth, at 7 per cent, is expected to be the fastest among the G20 economies.
- A virtual cottage industry in comparing the GDP and employment outcomes between the last pre-Covid year 2019 and the first post-Covid year 2022.
- There is an equal interest in comparative (and absolute) performance in terms of job growth.For most economies, it is too early to tell. But there are pointers.
- Employment recovery in the US has surprised many, and in 2022, employment in the US averaged 152 million a month, up marginally from its 2019 level of 150.9 million.
- US GDP was 3.7 per cent above the 2019 level, compared to India’s 8.4 per cent. Comparing with 2019 is correct — neither 2020 nor 2021 would be appropriate years of comparison since both years suffered from Covid effects.
Availability of employment related digital data and its outcome
- Unfortunately, while employment is a very important policy concern, data in India is scarce.
- Profound changes in fertility, workforce, income generation and labour force participation of women are happening. But we don’t know because government data is being released on a delayed and irregular basis.
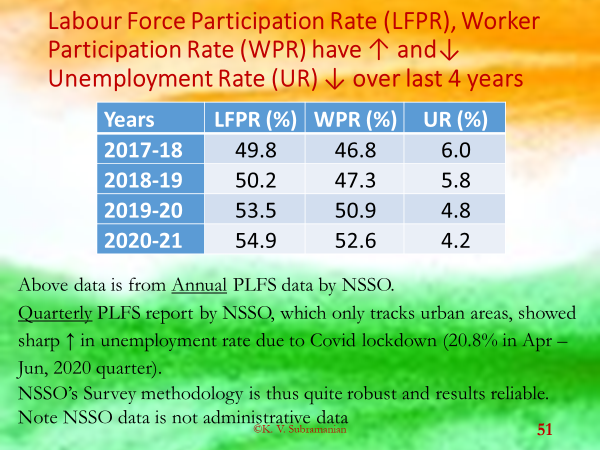
- In 2017-18, the NSO launched its periodic labour force survey (PLFS) with the promise that a timely quarterly employment series would be made available for urban areas, and an annual all-India series made available, after the completion of the July-June agricultural year.
- Unfortunately, this promise has not been kept, despite India being amongst the top two economies in the world for computer software, and the leading economy in terms of financial payments technology.
- The introduction of computer tablets over the years has considerably lessened, if not removed, concerns about the timeliness of data input. The time taken from the end of survey collection to tabulation/publication has been reduced to less than a month. Yet MOSPI is finding it difficult to release collected and processed data on time (“normal” MOSPI lag is six to nine months).
- Hence, the last available urban PLFS survey results (and these also in the form of a press release) are for the period July-September 2022; a quarterly bulletin with survey details is awaited, as well as the annual report, and data, for 2021-22.
There is increse in urban employment vis-i-vis GDP
- For urban areas only, one can assess the nature of employment expansion since 2019 by comparing the worker-participation rate for July-September 2022, with the corresponding pre-Covid July-September 2019 urban employment increased by a healthy 10.7 per cent in India, a rate matching the exceptional comparative growth in GDP
- Given that CMIE (the CPHS survey) has been doing its surveys continuously since 2015, there is plenty of CPHS-CMIE data to do a before-Covid (2019) and after-Covid (2022) comparison. The table presents such a comparison for 4 different age-groups (>=15 years, 15-24, 25-64 and 15-64 years).

- Non-availability of official data has allowed unofficial estimates about employment growth in India to flourish. One such unofficial estimate is in the form of a jobs bulletin jointly produced by Ashoka University’s Centre for Economic Data (CEDA) and CMIE.
- In complete contrast to the recovery in GDP between 2019 and 2022, the CEDA-CMIE study (The Long Road to Recovery, Preeta Joseph and Raashika Moudgill) claimed that 14 million jobs (3.4 per cent of the workforce) were lost between month of January 2020 and month of October 2022.
- The reason that month is italicised is because CMIE itself does not report monthly data on employment
- What the CEDA-CMIE report does is to synthetically construct monthly estimates from each set of data — January-April, May-August and September-December.
- Doing so yields the result that for the age-group of people more than or equal to 15, employment declined by 14 million in 2022 (or 3.4 per cent) between January 2020 and October ’22.
- India has been undergoing an extensive transformation in education (the youth opting for education rather than jobs).
- It is for this reason that the 25-64 age group might be considered the most “representative” of the job market.
- Nevertheless, we report the results for all five groups. In stark contrast to the CEDA-CMIE claim of a loss of 14 million jobs between January 2020 and October 2022, we find that for the same age-group (>=15 years), the non-interpolated, non-synthetic original CMIE data for the calendar year 2019 and 2022 shows a loss of only 4.7 million.
- And as documented above, the PLFS data for urban India alone shows a gain of 16 million between July-September 2019 and July-September 2022.
The issue with credibility of CPHS-CMIE data as compare to PLFS
- There are other more substantial reasons to doubt the credibility of the CPHS-CMIE data.
- The CPHS-CMIE female labour force participation rate (FLFPR) for 2019 is observed to be 11 per cent; for 2022 it is reported to be even lower at 8.7 per cent.
- The latest CPHS-CMIE data for urban FLFPR is a low 6.3 per cent (for September-December 2022).
- All these estimates are not only the lowest observed for India, but the lowest observed for any country, at any time, in recorded world history. PLFS estimates of FLFPR are close to three times higher than the CMIE estimate (around 27 per cent versus 9 per cent).
- The CPHS-CMIE estimates of urban male LFPR are also troublesome, but less so than female LFPR.
- In 2022, urban male LFPR of 68 per cent for PLFS is almost 10 percentage points higher than the CMIE estimate of 59.4 per cent.
- Even though CMIE and PLFS define employment differently, it is difficult to explain such a large difference in LFPR estimates obtained from the two sample surveys.
Need for timely release of dta for better outcomes / Conclusion
- The World Bank, in its report on Indian poverty, first accepted and then explicitly rejected the CPHS-CMIE weights and constructed its own weights in order to derive results about consumption and poverty reduction in India.
- For the uninitiated, (population) weights are the backbone of any household survey
- The non-timely release of the PLFS data emphasises the need for the government to introspect why its own data is kept unprocessed or delayed.
- No matter what the cause, the data are lost for all practical purposes. In this fast-moving world in which policy is meant to be made, official government data, collected, and tabulated, is staying in some government computer. If the collected data had been released on time, this article would have been unnecessary, as well as speculation about speculative job losses.
Editorial 2: INS Vagir commissioned into the Indian Navy: What are the features of the Kalvari-class submarine?
Recent Context:
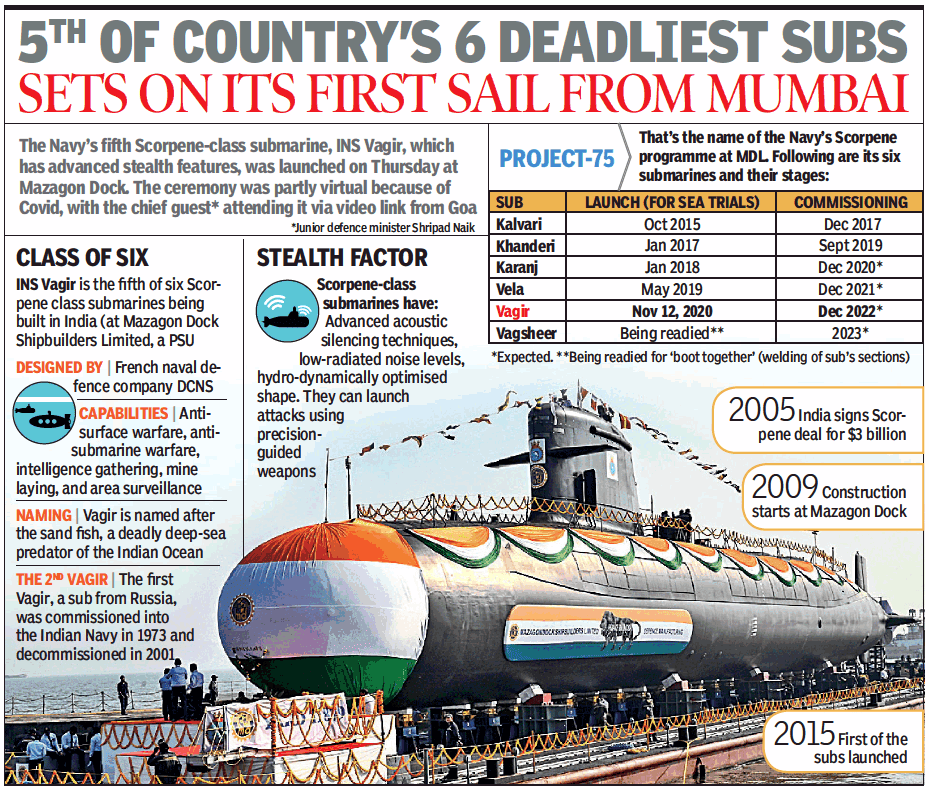
- Recently, The Indian Navy. It is among the six submarines being built by the Mazagon Dock Shipbuilders Limited (MDL), Mumbai, in collaboration with the French M/s Naval Group under Project 75.
- Four of these submarines have already been commissioned into the Navy and a sixth will be commissioned next year.
- “The induction of Vagir is another step towards the Indian Navy consolidating its position as a builder’s Navy, as it also reflects MDL’s capabilities as a premier ship and submarine building yard
What are the specifications of Vagir?
- The latest submarine gets its name from the erstwhile Vagir, a submarine which served the Navy between 1973 and 2001 and undertook numerous operational missions.
- The construction of the new Vagir began in 2009 which was delivered to the Indian Navy in December 2022.
- According to Indian Navy,
- Vagir represents stealth and fearlessness, as it comes with features like an advanced acoustic absorption technique.
- And It will boost the Indian Navy’s capability to further India’s maritime interests and is capable of undertaking diverse missions including anti-surface warfare, anti-submarine warfare, intelligence gathering, mine laying and surveillance missions”
Kalvari-class background
- Vagir is a Kalvari-class submarine, which includes other vessels, such as the INS Kalvari, INS Khanderi, INS Karanj, INS Vela and INS Vagsheer.
- Of these, Kalvari and Khanderi were commissioned in 2017 and 2019, and Vela and Karanj were inducted in 2021. Vagir has now been commissioned and Vagsheer was launched in 2022 and is expected to be inducted next year.
- The submarines in the current Kalvari-class take their names from erstwhile decommissioned classes of submarines named Kalvari, which included Kalvari, Khanderi, Karanj and Vela classes comprising Vela, Vagir, Vagshir.
- The now-decommissioned Kalvari and Vela classes were one of the earliest submarines in the post
Significance of Names and classification of Navy Vehilcles
- In maritime parlance, a class of ships is a group of vessels which have the same make, purpose and displacement.
- In the Navy and Coast Guard in India, the ships belonging to a particular class are named in a specific manner.
- Many times the names have the same first letters, prefixes, and similar meanings or the names belong to a particular type of word, for example, names of cities, persons, mythological concepts, animals, rivers, mountains, weapons, etc.
- The class is generally named after the first vessel in the category. In some cases, a particular class of vessels take their names from an earlier class of vessels which are now decommissioned.
- Like Kalvari – which means Tiger Shark, Vagir has been named after a Sand Fish, a predatory marine species. Khanderi has been named after an Island Fort built by Chhatrapati Shivaji, which played a key role in his Navy. Karanj has also been named after an Island located South of Mumbai.
Capabilities and technical details of INS Vagir
- The design of the Kalvari-class of submarines is based on the Scorpene class of submarines designed and developed by French defence major Naval Group formerly DCNS and the Spanish state-owned entity Navantia.
- This class of submarines have Diesel Electric transmission systems and these are primarily attack submarines or ‘hunter-killer’ types which means they are designed to target and sink adversary naval vessels.
- The Kalavari class of submarines have an estimated endurance of approximately 50 days. They also have the capability of operating in a wide range of Naval combat including anti-warship and anti-submarine operations, intelligence gathering and surveillance and naval mine laying.
- These submarines are around 220 feet long and have a height of 40 feet. It can reach the highest speeds of 11 knots (20 km/h) when surfaced and 20 knots (37 km/h) when submerged
- The modern variants of the Scorpene class of submarines have what is called Air Independent Propulsion (AIP) which enables non-nuclear submarines to operate for a long time without access to surface oxygen.
- It also needs to be noted that the Defence Research and Development Organisation (DRDO) has an ongoing programme to build a fuel cell-based AIP system for Indian Naval Submarines.
- The Kalvari class of submarines are capable of launching various types of torpedoes and missiles and are equipped with a range of surveillance and intelligence-gathering mechanisms.
Strategic importance
- India currently operates one submarine in the nuclear-powered class of Chakra and two other nuclear-powered vessels in Arihant in addition to submarines belonging to three classes of Diesel Electric category; Kalvari, Shishumar and Sindhughosh, some of which are ageing.
- The nuclear-powered and diesel-electric submarines have their designated roles in the Carrier Battle Groups, which are formations of ships and submarines with Aircraft Carriers in the lead role.
- As per the basic principles of submarine deployment and minimum requirement for India to create a strategic deterrence, there is a specific number of submarines of both types that India needs to have in active service.
- Currently, India has less number of submarines than what is required with some more of those from both types being at various stages of construction. Currently, India has a less-than-ideal number of submarines, with many new ones being at various stages of construction.
Conclusion:
- Building and commisioning of Subamrines will strengthen India’s Capability in Indo-pacific region which will help in countering the China’s aggessive maritime policy belt and Road initiave.
- It will also stregthen the India’s position as net maritime security provider to littoral states of Indian ocean .